Johns Hopkins University Updates the Coronavirus Map by Adding Local Data
March 26, 2020
IBL News | New York
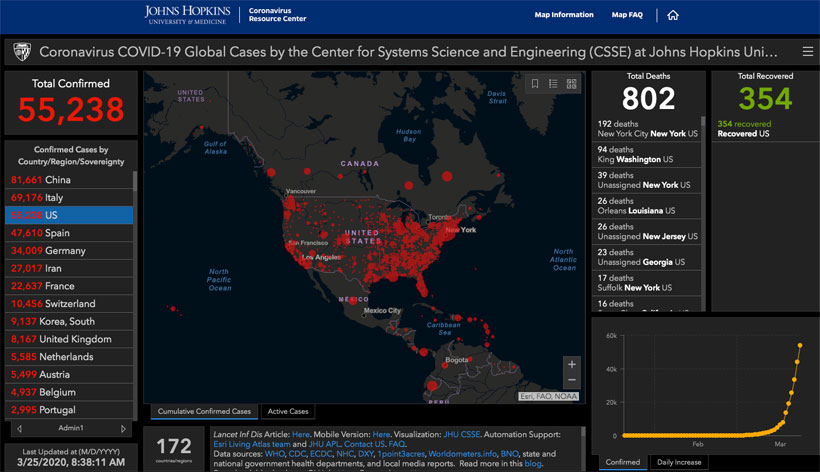
Johns Hopkins University upgraded its Coronavirus COVID-19 Map to include local data from every city and county in the U.S. The map is maintained in real-time throughout the day.
Initially, the map followed the naming scheme used by the World Health Organization. It then switched to the names of nations designated by the U.S. State Department.
The website relies upon publicly available data from multiple sources that do not always agree. More frequent updates to the map, it often results in higher case numbers than what may be available from other sources that are updated less frequently.
These are the data sources included in the map:
- World Health Organization,
- U.S. Centers for Disease Control and Prevention,
- European Center for Disease Prevention and Control,
- National Health Commission of the People’s Republic of China,
- 1point3acres,
- Worldometers.info,
- BNO,
- State, and national government health departments
- Local media reports
- DXY, one of the world’s largest online communities for physicians, health care professionals, pharmacies and facilities.
The dashboard was built by Professor Lauren Gardner, a civil and systems engineering professor at Johns Hopkins University, with her graduate student, Ensheng Dong. It is maintained at the Center for Systems Science and Engineering at the Whiting School of Engineering, with technical support from ESRI and the Johns Hopkins University’s Applied Physics Laboratory.
All data collected and displayed are made freely available through a GitHub repository
The map and additional resources are available on Johns Hopkins’ online portal.
There is an embed code for the dashboard:
<iframe width=”650″ height=”400″ frameborder=”0″ scrolling=”no” marginheight=”0″ marginwidth=”0″ title=”2019-nCoV” src=”//gisanddata.maps.arcgis.com/apps/Embed/index.html?webmap=14aa9e5660cf42b5b4b546dec6ceec7c&extent=77.3846,11.535,163.5174,52.8632&zoom=true&previewImage=false&scale=true&disable_scroll=true&theme=light”></iframe>
This is how it looks:
Discover more
IBL News is funded by the New York-based, family-owned company ibl.ai. Our stories adhere to the highest ethical standards in journalism and are available to news syndication agencies.